Corrective Waves in Elliott Wave Theory : Understanding Market Corrections for Better Trading Decisions
Corrective Waves are one of the most important concepts in Elliott Wave Theory. While impulse waves represent the primary trend of the market, corrective waves move against that trend and help the market regain balance before the next major move. Understanding corrective waves is essential for traders and investors who use Elliott Wave Analysis to forecast future price movements in stocks, forex, cryptocurrencies, and commodities.
What Are Corrective Waves?
In Elliott Wave Theory, market prices move in a repeating cycle of five impulse waves followed by three corrective waves. The corrective phase is typically labeled as A-B-C and occurs after the completion of a five-wave impulse pattern.
Corrective waves represent temporary pauses or retracements in the prevailing trend. During this phase, traders take profits, market sentiment shifts, and prices move against the main trend before the larger trend resumes.
Unlike impulse waves, corrective waves are generally more complex and difficult to identify because they can take multiple forms and structures.
A complete Elliott Wave cycle consists of five motive waves followed by three corrective waves. The corrective phase is typically labeled A-B-C, where the market retraces a portion of the previous impulsive move before the main trend resumes.
Corrective waves represent periods of consolidation, profit-taking, and uncertainty. They are often more complex than impulse waves because they can take various shapes and structures.
Understanding corrective waves is essential for successful Elliott Wave Trading Strategy, as they provide opportunities to enter trades at favorable prices before the next trend begins.
Structure of Corrective Waves
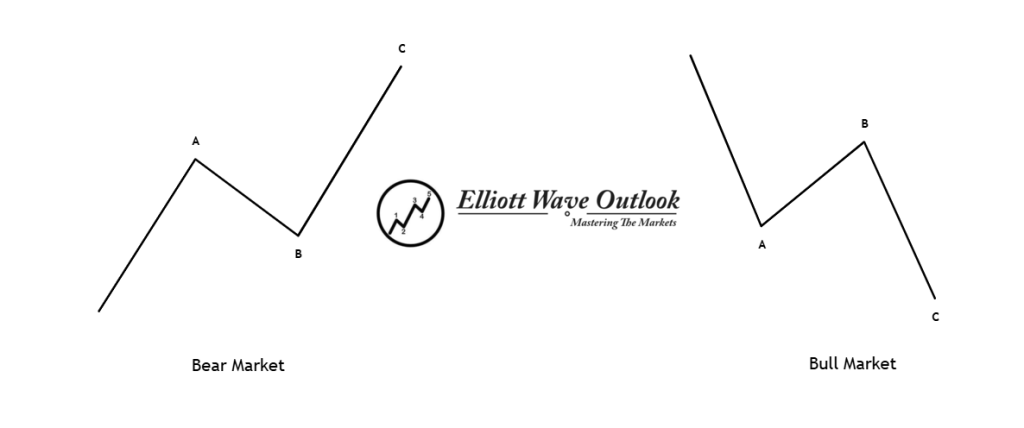
The standard corrective pattern consists of three waves:
Wave A
Wave A marks the beginning of the correction and moves against the prevailing trend. Many traders initially mistake this move for a temporary pullback.
Wave B
Wave B retraces part of Wave A and often creates the illusion that the original trend is continuing. This wave can be deceptive because it frequently traps traders.
Wave C
Wave C is usually the strongest wave in the correction and completes the corrective pattern. It often extends beyond the end of Wave A before the market resumes its primary trend.
This A-B-C structure forms the foundation of Elliott Wave Pattern recognition. In a bullish market, Wave A and Wave C move downward, while Wave B moves upward. In a bearish market, the opposite occurs. This A-B-C structure forms the foundation of Elliott Wave Chart Analysis and helps traders identify potential reversal zones.
Types of Corrective Waves
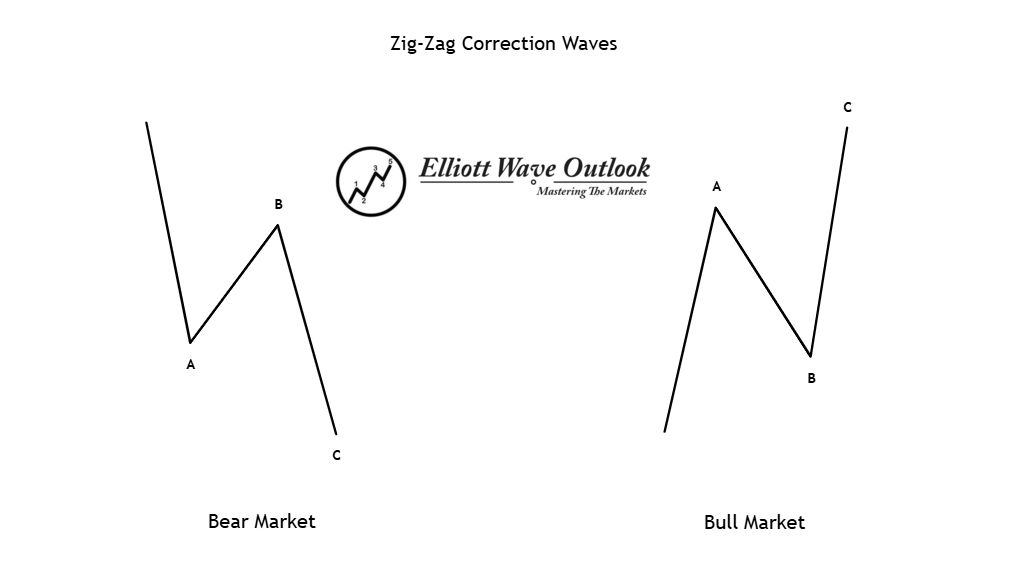
1. Zigzag Correction
A Zigzag follows a 5-3-5 structure and represents a sharp correction against the trend. It is one of the most common patterns in Elliott Wave Chart Analysis.
Characteristics:
- Strong Wave A movement
- Moderate Wave B retracement
- Powerful Wave C decline or advance
2. Flat Correction
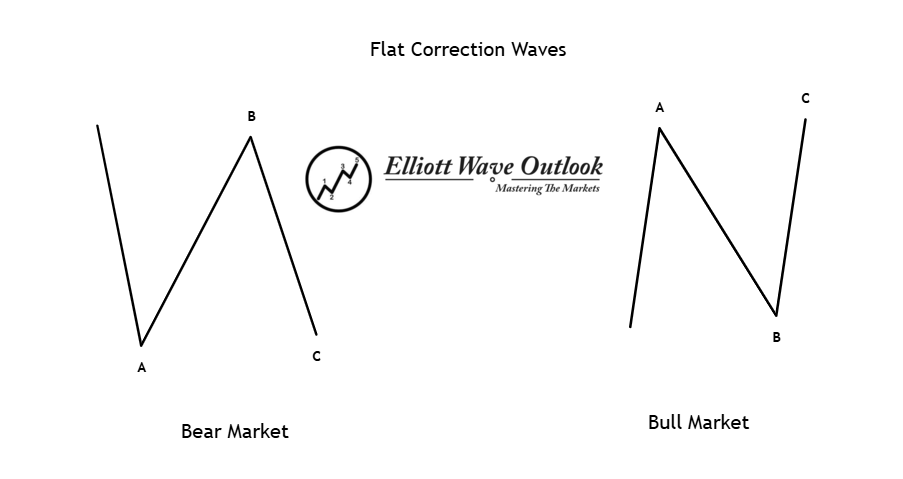
A Flat correction follows a 3-3-5 structure and usually occurs during sideways market conditions.
Characteristics:
- Wave A consists of three waves
- Wave B retraces most of Wave A
- Wave C completes the correction with five waves
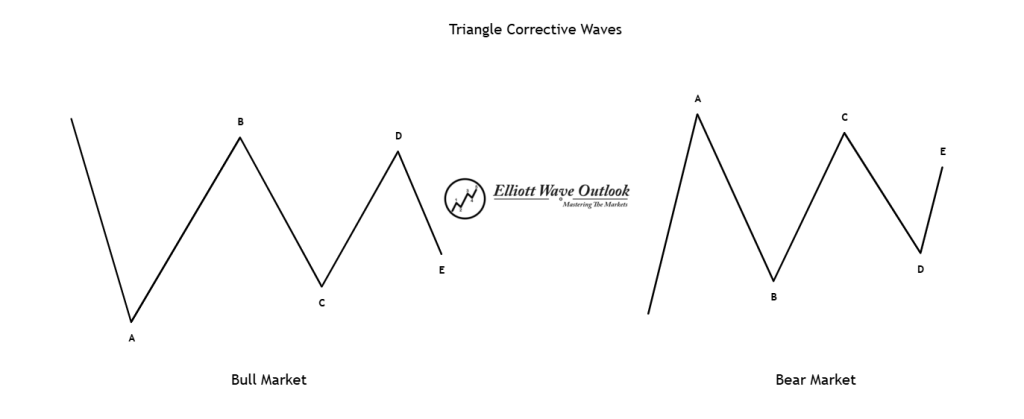
3. Triangle Correction
Triangles consist of five overlapping waves labeled A-B-C-D-E. These patterns often indicate a period of consolidation before a breakout.
Characteristics:
- Contracting price range
- Lower volatility
- Often appears before the final impulse wave
Triangles are widely used in Technical Analysis Elliott Wave studies to forecast potential market breakouts.
Select the Related Topic
Trading Corrective Waves Effectively
To trade corrective waves successfully:
- Identify the larger market trend.
- Recognize the A-B-C corrective structure.
- Use Fibonacci retracement levels for confirmation.
- Wait for corrective completion before entering trades.
- Apply proper risk management and stop-loss placement.
These practices form the foundation of a reliable Elliott Wave Trading System.
Role of Fibonacci in Corrective Waves
The relationship between Fibonacci Elliott Wave levels and corrective waves is extremely important. Traders often use Fibonacci retracement levels such as 38.2%, 50%, and 61.8% to estimate where corrections may end.
For example:
- Shallow corrections often retrace 38.2%
- Moderate corrections commonly retrace 50%
- Deep corrections may reach 61.8%
Combining Fibonacci analysis with Elliott Wave patterns increases the accuracy of Elliott Wave Prediction. These levels help traders estimate where a corrective wave may end and where the next impulse wave may begin.
Corrective Waves in Forex, Stocks, and Cryptocurrency
Corrective waves appear in all financial markets, including:
- Elliott Wave Forex Trading
- Elliott Wave Stock Market
- Elliott Wave Cryptocurrency Analysis
Whether analyzing EUR/USD, major stock indices, or Bitcoin, corrective waves help traders identify temporary retracements and prepare for future trend continuation.
1. Elliott Wave Forex Trading
Forex traders monitor corrective waves to enter positions at favorable prices. Understanding corrections can improve risk management and trade timing.
2. Elliott Wave Stock Market Analysis
In stock markets, corrective waves often appear after strong rallies or sharp declines. Investors use them to identify buying opportunities during temporary pullbacks.
3. Elliott Wave Cryptocurrency Analysis
Cryptocurrency markets are highly volatile, making corrective wave analysis especially valuable. Identifying A-B-C corrections helps traders anticipate major trend continuations and reversals.
Corrective waves are a crucial component of Elliott Wave Theory and play a vital role in understanding market behavior. By mastering Zigzags, Flats, and Triangles, traders can better anticipate reversals and trend continuations. Combined with Elliott Wave Analysis, Fibonacci retracements, and sound risk management, corrective waves become a powerful tool for improving trading performance across forex, stocks, and cryptocurrency markets.